In this article:
Overview - Basic overview of the data provider system
Data Provider Types - Overview of the different types of data provider
Creating a New Data Provider - How to author a new Data Provider
Adding a Dataset - How to add a Dataset to a Data Provider
Further Information - Where to go for further information
Overview
The Adaptiva Data Providers are used primarily by the dashboarding system to retrieve data from the underlying SQL database for use in tables, charts and other widgets. They are also used for alerts.
The Data Provider is the container that holds one or more Datasets. The Datasets are the component that hosts the configuration for pulling the data (such as the SQL query or workflow).
Data Providers are a platform-level component and can therefore be accessed when viewing any Adaptiva product from the left-hand menu. Navigate to Dashboards > Data Providers.
Data Provider Types
There are currently two types of Data Provider:
- Adaptiva SQL - queries data from the Adaptiva SQL database
- Workflow - executes a workflow to return data
Creating a New Data Provider
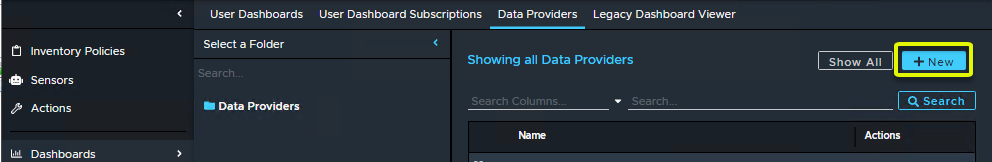
To author a new Data Provider from the Data Provider browser, select +New in the top-right corner
To author a new Data Provider from within the Data Provider editor, select +New in the top-right corner
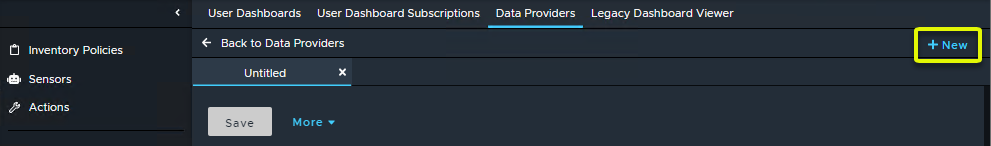
This will open a new editor window where you can author a new Data Provider.
Set the Data Provider Details
Start by giving the data provider a Name, and optionally a Description.
Next, choose the Data Provider Type to create, Adaptiva SQL or Workflow.
In the Product Notification dropdown, choose the product most closely associated with the data being pulled. This will enable the data to update dynamically when it receives notifications associated with that product.
If there is a specific notification that is thrown that should be used as an indicator to update data, this can be added to the Generic Notifications section. This is rarely used by custom data providers.
If the dataset requires input parameters (such as passing data to SQL), you can add global, provider-level properties by clicking the Add Property button.
Note: User Dashboards do not require properties to be defined here. They are passed through dynamically.
This will open the Global Property window. Here you can enter the Name of the property which must match exactly with the name of the property being referenced in your dataset (e.g. in your SQL query), as well as the Property Type. You can enter a Default Value and choose whether the property is Mandatory, Hidden and/or Read Only.
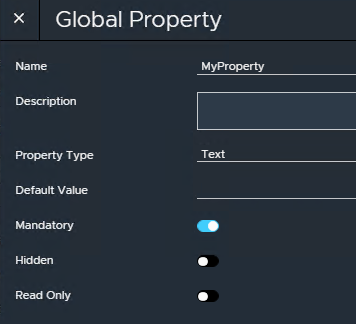
Example: A text property called MyProperty. This would be referenced in SQL as @property(MyProperty,,,)
For this example, we will be creating a data provider for retrieving the results of a sensor inventory policy which retrieves basic BIOS information. This can later be used in a user dashboard to show the same information.
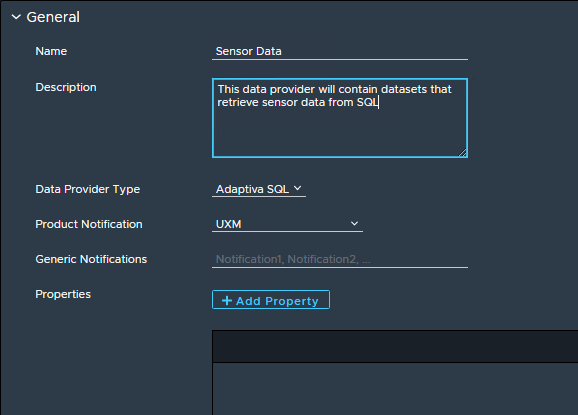
Here we have named the data provider Sensor Data, selected Adaptiva SQL as the type and UXM as the product notification provider. This will have no generic notifications and no properties.
The next step is to add a Dataset.
Adding a Dataset
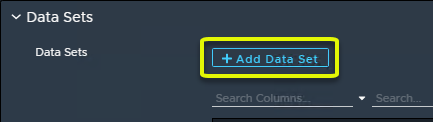
To add a new dataset, click the +Add Data Set button
This will bring out the Data Set editor.
First, give the data set a Name and optionally, a Description.
SQL Data Sets
For SQL data sets, it is important to first decide on what output the SQL query will return. The output schema of the query will be required in order to configure the data set.
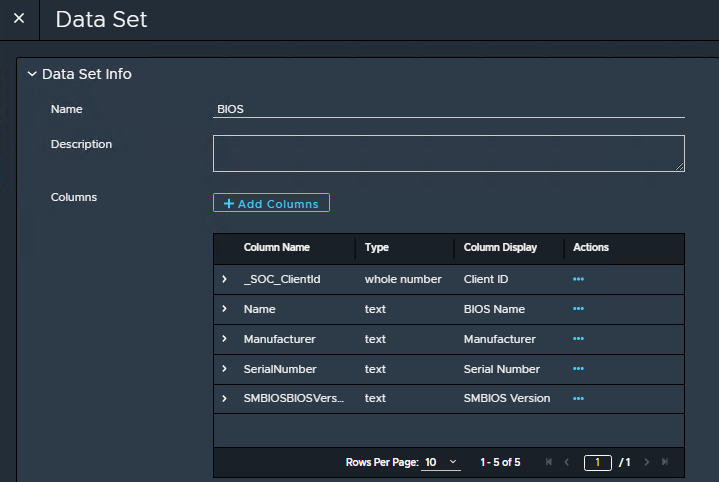
For this example, we will be querying from the SENSOR_200000017_DATA table (BIOS sensor). The columns we will be selecting will be the Client ID, the BIOS Name, the Manufacturer, the SerialNumber, and the SMBIOSBIOSVersion. The resultant query is:
SELECT _SOC_ClientId, [Name], Manufacturer, SerialNumber, SMBIOSBIOSVersion
FROM SENSOR_200000017_DATA
Now that we know the schema (column names and data types), we can define the data set.
For each column returned by the query we need to add a new column by clicking the +Add Columns button. This will open the Dataset Columns window.
In here, we define the following properties:
- Column Name: This must match EXACTLY with the name of the column in the SQL query.
- Column Display: This will be the name that is displayed for this column, which can be anything, and different from the column returned by the SQL query.
- Column Type: This must match the data type of the data returned by SQL for this column.
- Visible: This will control whether this column is visible within tables.
- Display Level: For tables, data can either be displayed in a table row, or it can be displayed when the row is expanded, by clicking the expand icon for that row. The display level allows you to configure how the data will be shown in the table.
- Searchable: This defines whether this column is searchable within a table.
- Sortable: This defines whether this column is sortable within a table.
- Link: This will link the row to another dashboard, so that when it is clicked, the UI navigates to that page.
Once you have defined your desired settings, click +Add Column to add to the column definition. You can continue adding columns in this way until finished and then click Save to commit all columns to the dataset.
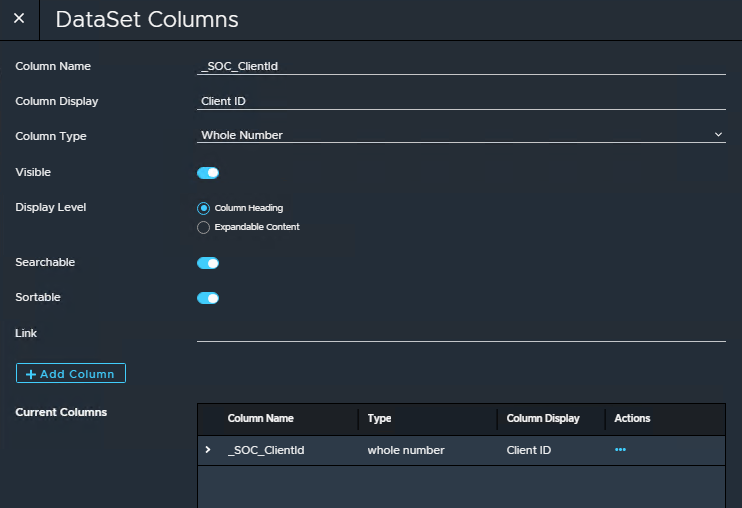
Example: The first column from the above SQL query (_SOC_ClientId), mapped to a column display value of Client ID. It is a numeric value so has a Whole Number column type. It's visible, searchable and sortable and will be shown as a column within the table, rather than in the expandable content.
After adding all columns, the dataset now looks like this:
Next, we need to provide the output schema in the Schema box. This should be a comma-separated list of column names and datatypes (in the format t=text, n=number, b=boolean, d=date/time)
Therefore, for our example schema, we would specify:
_SOC_ClientId,n,Name,t,Manufacturer,t,SerialNumber,t,SMBIOSBIOSVersion,t
![]()
For the Schema Displays, this is optional, and not required if defining columns using the columns section above.
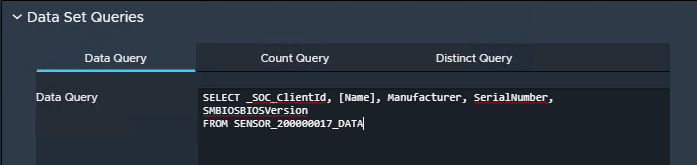
Next, we have to tell the dataset what query to use. Here we have to provide two things - the query to fetch the data, and the query to fetch the count. The count is used to determine how many rows to fetch.
In the Data Set Queries section, add the data query into the Data Query section:
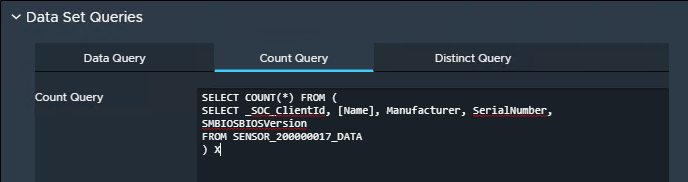
Next, switch to the Count Query section and add a query that will retrieve the number of rows that this query will return.
Here, I am simply wrapping the query in a separate COUNT query:
SELECT COUNT(*) FROM (
SELECT _SOC_ClientId, [Name], Manufacturer, SerialNumber, SMBIOSBIOSVersion
FROM SENSOR_200000017_DATA
) X
The Distinct Query is not required.
If the SQL query takes input parameters, these can be specified here at the dataset level by using the Custom Properties section.
Note: User Dashboards do not require properties to be defined here. They are passed through dynamically.
Once the SQL query and count query have been defined, click Save to commit the dataset back to the data provider.
The data provider should show the dataset listed in the Data Sets section
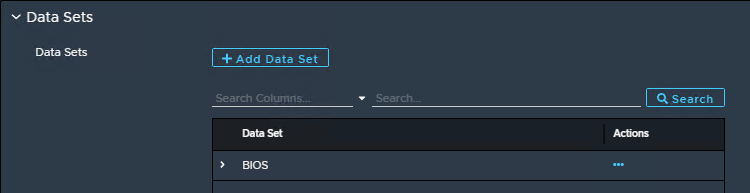
Additional datasets can be added if required. Multiple datasets are common, especially if a user dashboard requires multiple charts, tables and/or other widgets.
Once all datasets are added, click the Save button at the top.
The data provider is now available and ready for use.
Workflow Data Sets
For Workflow data sets, it is important to first decide on what output the workflow will return. The output schema of the workflow will be required in order to configure the data set.
Workflows that are to be used as datasets must output Rows in the ResultArrayOfRows property of the workflow End node.
For this example, we will be executing the built-in workflow Get Adaptiva Server Details - Data provider.
This workflow retrieves the Adaptiva Server FQDN, IP Address and Adaptiva Version. Please see this workflow as an example of how to output rows.
Now that we know the schema (column names and data types), we can define the data set.
For each column (user-defined property of the row object) returned by the workflow, we need to add a new column by clicking the +Add Columns button. This will open the Dataset Columns window.
In here, we define the following properties:
- Column Name: This must match EXACTLY with the name of the user defined property on the row object in the workflow.
- Column Display: This will be the name that is displayed for this column, which can be anything, and different from the user defined property on the row object in the workflow.
- Column Type: This must match the data type of the data returned by the workflow for this column.
- Visible: This will control whether this column is visible within tables.
- Display Level: For tables, data can either be displayed in a table row, or it can be displayed when the row is expanded, by clicking the expand icon for that row. The display level allows you to configure how the data will be shown in the table.
- Searchable: This defines whether this column is searchable within a table.
- Sortable: This defines whether this column is sortable within a table.
- Link: This will link the row to another dashboard, so that when it is clicked, the UI navigates to that page.
Once you have defined your desired settings, click +Add Column to add to the column definition. You can continue adding columns in this way until finished and then click Save to commit all columns to the dataset.
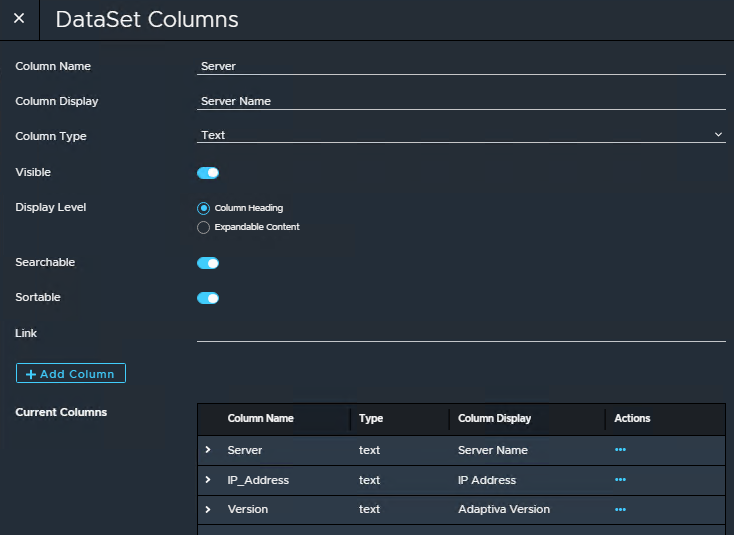
Example: The first column from the above workflow (Server), mapped to a column display value of Server Name. It is a text value so has a Text column type. It's visible, searchable and sortable and will be shown as a column within the table, rather than in the expandable content.
After adding all columns, the dataset now looks like this:
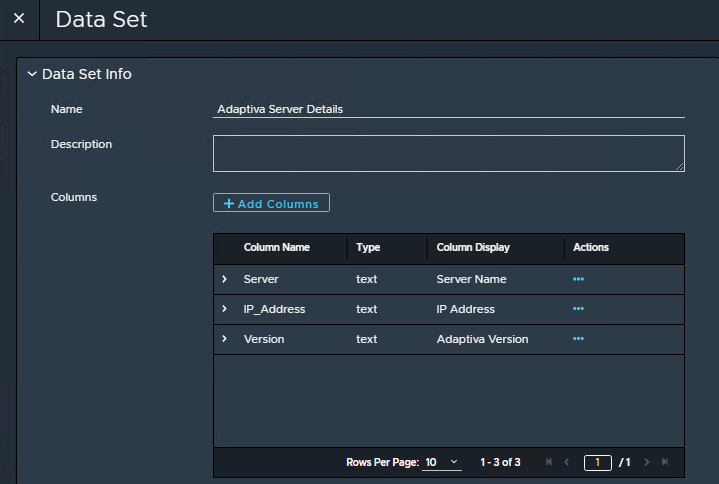
Next, we need to provide the output schema in the Schema box. This should be a comma-separated list of column names and datatypes (in the format t=text, n=number, b=boolean, d=date/time)
Therefore, for our example schema, we would specify:
Server,t,IP_Address,t,Version,t

For the Schema Displays, this is optional, and not required if defining columns using the columns section above.
Next, we have to tell the dataset what workflow to use. Here we will select our Get Adaptiva Server Details - Data provider workflow
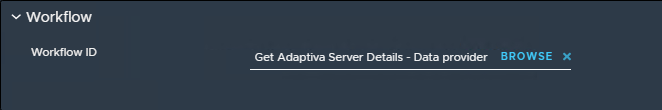
If the workflow takes input parameters, these can be specified here at the dataset level by using the Custom Properties section.
Note: User Dashboards do not require properties to be defined here. They are passed through dynamically.
Once the workflow has been added, click Save to commit the dataset back to the data provider.
The data provider should show the dataset listed in the Data Sets section
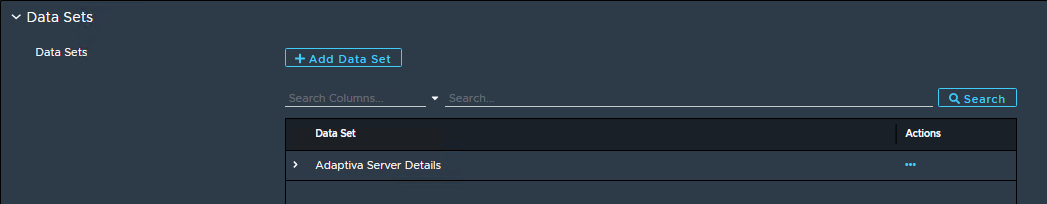
Additional datasets can be added if required. Multiple datasets are common, especially if a user dashboard requires multiple charts, tables and/or other widgets.
Once all datasets are added, click the Save button at the top.
The data provider is now available and ready for use.
Further Information
For further information, please see the other resources in the Technical Reference Library or speak to a member of Adaptiva Support.
If you experience any issues or suspect there is a bug in any part of the data provider system, please log a support ticket and a member of the Adaptiva support team will be touch as soon as possible.
Comments
0 comments
Article is closed for comments.